
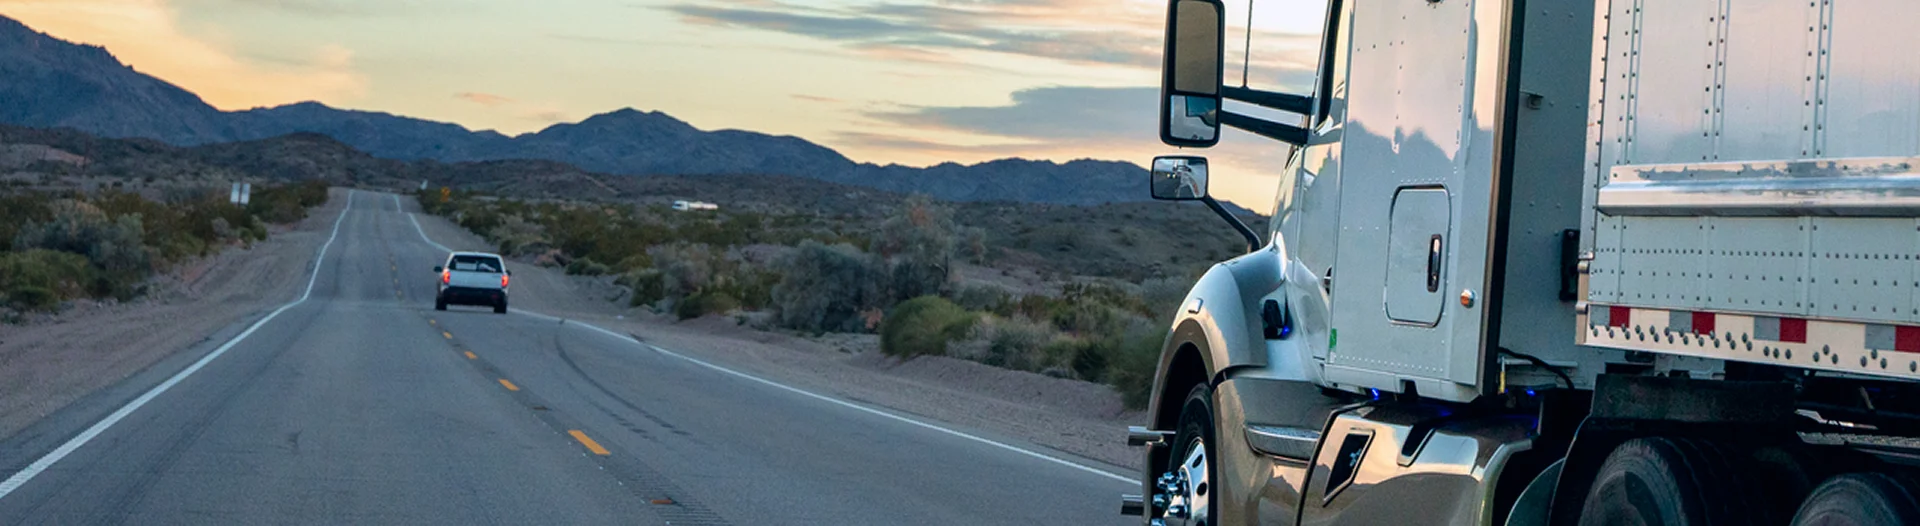
Brake fade is a loss of braking effectiveness caused by heat.
In commercial trucks, that heat is produced every time the braking system converts speed and vehicle weight into thermal energy. Under ordinary braking, the system can absorb and release that heat. Under repeated hard braking, long downhill travel, stop-and-go congestion, or heavy-load operation, heat can build faster than the braking system can dissipate it. When that happens, friction surfaces lose effectiveness, brake torque drops, and stopping distance increases even when the driver continues applying the brakes.
Brake fade differs from a ruptured air line or a missing brake component. The brake system may still be mechanically present, and the driver may still feel pedal resistance, but the system may no longer produce the stopping force expected under normal conditions. Overheated friction material can form a film or gas layer that reduces contact between pad and disc, producing a heat-related loss of braking force known as friction fade.
In heavy-duty vehicles, the consequences are amplified because commercial trucks must dissipate far more kinetic energy than passenger vehicles. Brake fade in heavy-duty vehicles appears as reduced stopping power caused by excessive heat from repeated or prolonged brake use, especially during long descents, stop-and-go operation, or repeated hard stops.
Why Brake Fade Is Dangerous
Brake fade is dangerous because it reduces braking force at the moment braking demand is highest. A tractor-trailer approaching stopped traffic, descending a grade, or entering a work zone may need maximum deceleration within seconds. If heat has already reduced friction effectiveness, additional pedal effort may not produce proportional braking response.
Commercial braking systems depend on friction surfaces, brake drums or rotors, adjustment condition, and air-system performance working together. If any part of that system is already compromised, the thermal margin before fade occurs may be reduced.
There are three related fade mechanisms: friction fade, fluid fade, and green fade. DOT 3 brake fluid has a dry boiling point of about 401°F, while DOT 4 has a dry boiling point of about 446°F, and moisture contamination lowers boiling points.
Although heavy trucks often use air brakes rather than hydraulic systems, the same broader principle applies. Heat changes braking performance. In air-brake drum systems, overheating can reduce friction between linings and drums, expand drums, glaze friction surfaces, and reduce the torque produced at the wheel end.
Vehicle Mass & Road Grade Drive Brake Fade Risk
One of the strongest technical sources for understanding brake fade is Heavy Road Vehicle Platoon Control Considering Brake Fade with Adaptive Mass and Road Gradient Estimation. The paper treats brake fade as a performance variable that must be modeled because heavy-vehicle braking capability changes with vehicle mass, roadway grade, and brake temperature.1
The key point is that brake fade is not simply a matter of driver pedal use. It is tied to load and road geometry. A lightly loaded truck on level pavement does not impose the same thermal demand as a loaded combination vehicle descending a steep grade. The paper’s modeling framework uses adaptive mass and road-gradient estimation because both variables affect braking demand during heavy-vehicle operation.2 The paper’s test conditions included downhill operation at a -10% slope and 50 km/h, with both homogeneous and heterogeneous loading scenarios. That matters because steep grades and variable loads are common real-world conditions in which brake systems must control speed while absorbing sustained thermal energy.3
For crash reconstruction, the takeaway is direct: investigators should not evaluate brake condition only by asking whether parts existed. They should also ask whether sufficient braking torque was available when the driver needed it, given the truck’s load, grade, speed, and prior brake use.
Brake Fade Changes Stopping Distance & Safe Spacing
The platoon-control research also matters because it shows that brake fade changes spacing assumptions between heavy vehicles. In a platoon, each vehicle’s ability to maintain safe distance depends on predictable braking response. If braking effectiveness decreases as heat builds, spacing requirements must change because the vehicle can no longer decelerate as expected.4
That point applies outside automated platooning. A truck following traffic downhill may start with adequate braking capacity but lose performance after repeated brake applications. The truck near the bottom of the grade may have a longer stopping distance than it had at the top.
FMCSA brake-system guidance illustrates how repeated stops can change braking distance.
That example captures the core danger of brake fade. The issue is not whether a truck can stop once. The issue is whether it can continue stopping after repeated brake applications generate heat.
Thermal Energy Research Shows Why Fade Develops
Peer-reviewed research on braking thermal behavior addresses the same underlying problem from an energy perspective: braking systems lose efficiency when thermal degradation affects braking performance. The research describes thermal fade as a condition that can compromise vehicle safety and stability.6
The significance for commercial trucks is that braking systems are heat-management systems. Every stop converts vehicle motion into heat. The heavier the vehicle, the greater the energy that must be absorbed. The steeper the grade, the longer the braking system must manage gravitational energy. If the brake system’s ability to shed heat is lower than the heat being generated, temperature rises and brake effectiveness declines.7
The vehicle braking research also explains that braking degradation becomes more pronounced when vehicle mass, road gradient, and braking demand increase.8 This is why downgrade travel is a recurring setting for brake-fade analysis. Long descents require sustained braking effort. If the driver relies heavily on service brakes instead of engine braking, lower gears, or proper speed control, the service brakes may absorb more heat than they can release.
Downgrade Testing Shows How Quickly Heat Can Build
A University of Michigan Transportation Research Institute report on braking strategy during mountain descents tested braking on long, steep grades of approximately 6% to 7% for five miles. The report compared snubbing and dragging strategies and measured brake temperatures using a mobile dynamometer.9 The report explained that snubbing slowed the vehicle by about 6 mph in approximately 3 seconds, with snubbing pressures greater than 20 psi, while light dragging used pressures under 10 psi. It found that snubbing helped produce more uniform brake temperatures, while dragging could create hotter brake conditions on shorter descents.10
The same report described rear brake cooling as slow. One example indicated that a rear brake could take approximately 20 minutes to cool from 600°F to 200°F at 50 mph. It also described NHTSA testing of a nearly 80,000-pound tractor-semitrailer where test runs were stopped when the hottest brake approached approximately 1,000°F.11 Those numbers show why fade can persist.
A truck that overheats its brakes halfway down a grade may not recover full braking performance before reaching traffic, curves, ramps, or stop-controlled intersections.
Crash Evidence Linking Brake Condition to Truck Crashes
The Large Truck Crash Causation Study provides the crash-investigation framework for evaluating braking problems in serious truck crashes. The LTCCS gathered data from 1,070 crashes involving 2,284 vehicles, and weighted estimates represented approximately 120,000 crashes and 241,000 vehicles, including about 141,000 large trucks.12
FMCSA’s LTCCS analysis explains that the study collected more than 1,000 variables describing drivers, vehicles, roadway conditions, weather, cargo, brakes, vehicle weight, and crash sequence.13 For braking issues, the FMCSA LTCCS analysis brief uses Michigan State Police FACT data (1996–2001) as an illustrative example of the kind of statistical analysis LTCCS supports.
The analysis concluded that trucks in braking-critical crashes were 50% more likely to have brake violations, and the chi-square test showed a 2.7% probability that there was no association.14 That does not mean every brake violation involved brake fade. It does show that brake condition matters most in the crash scenarios where stopping performance is central. Brake fade belongs in that analysis because it reduces stopping force during repeated or sustained braking.
NHTSA’s National Motor Vehicle Crash Causation Survey investigated 5,470 crashes, representing an estimated 2,189,000 crashes nationwide. It estimated that vehicle-component failure or degradation was assigned as the critical reason in about 2% of crashes.15
Within that vehicle-related category:
- Brake-related problems: approximately 22%, representing about 10,000 estimated crashes
- Tire and wheel problems: about 35%
- Steering, suspension, transmission, or engine-related problems: about 3%
- Other or unknown vehicle-related problems: about 40%
NHTSA cautioned that vehicle-related critical reasons were based mainly on external visual inspections and may not capture internal vehicle problems.16 That limitation is important for brake fade because fade may not leave the same obvious evidence as a missing component or flat tire.
Roadside Inspection Data Shows Brake Defects Are Common
Roadside inspection campaigns show how frequently brake problems exist before crashes occur. During the 2019 International Roadcheck, inspectors conducted more than 67,000 inspections and placed 12,019 vehicles out of service for vehicle-related violations.
Brake violations were dominant:17
- Brake-system violations: 4,578 vehicle out-of-service violations (28%)
- Brake-adjustment violations: 2,801 (17.1%)
- Combined: 45.1% of vehicle out-of-service violation categories reported in 2019
The 2025 International Roadcheck results show the same pattern. Inspectors conducted 44,435 Level I, II, and V inspections and recorded 13,553 out-of-service vehicle violations:18
- Brake systems: top vehicle out-of-service category, with 3,304 violations (24.4%)
- The "20% defective brakes" category: 2,257 violations (16.7%)
Brake-focused campaigns provide additional context. CVSA’s 2019 Brake Safety Week involved 34,320 inspections, with 4,626 vehicles placed out of service after critical brake conditions were found. CVSA’s 2019 unannounced Brake Safety Day involved 10,358 inspections and 1,667 vehicles placed out of service for brake-related critical items, a 16.1% out-of-service rate.19 These numbers do not isolate brake fade specifically, but they show that brake condition problems are widespread across the operating fleet.
Brake fade becomes more dangerous when combined with out-of-adjustment brakes, worn linings, cracked drums, contaminated friction surfaces, or air-pressure defects.
Brake Hardware Condition, Wheel-End Heat & the Development of Brake Fade
Brake fade is more likely when friction components are already worn or damaged.
Rotors and drums also affect heat management. Rotors should be replaced when warped or worn beyond discard thickness, and machining rotors can reduce heat-dissipation capacity. CVSA’s 2025 Brake Safety Week focus on drums and rotors explained that drum and rotor defects may affect brake efficiency and that broken pieces can dislodge from a vehicle, damaging other vehicles or injuring the public.20 These maintenance details matter because brake fade is not only a driver-technique issue.
A vehicle with marginal brake hardware has less capacity to absorb repeated braking heat before performance declines.
The NTSB’s report on the Interstate 45 motorcoach fire during Hurricane Rita evacuation illustrates how wheel-end heat can become part of a catastrophic crash sequence. The crash resulted in 23 fatalities, 2 serious injuries, and 19 minor injuries.21 The NTSB found that insufficient lubrication led to increased temperatures, failed wheel bearings, and ignition of the tire. The report also discussed wheel-end heat effects and noted fire-history data from companies that included brake-system and wheel-bearing fires.22
The relevance to brake fade is that commercial-vehicle wheel ends are thermal systems. Brakes, hubs, bearings, drums, rotors, and tires operate close together.
Overheating may leave evidence beyond the lining itself:
- Discoloration
- Cracking
- Glazing
- Melted components
- Tire damage
- Bearing heat damage
Brake fade often announces itself through longer stopping distance, burning smell, smoke, vibration, pulling, or changing pedal feel. Continued operation with overheated brakes can progress to total brake failure.
For reconstruction, brake fade must be evaluated as a sequence. Investigators examine multiple factors:
- The truck’s weight
- Route and grade
- Speed
- Brake application history
- Engine-brake use
- Driver technique
- Maintenance records
- Inspection history
- Wheel-end condition
FMCSA reported that in 2021, 5,904 large trucks and buses were involved in fatal crashes, an 18% increase from 2020. Large trucks involved in injury crashes increased from 105,000 to 117,000, and large trucks involved in property-damage-only crashes increased from 322,000 to 401,000.23 The 2022 Large Truck and Bus Crash Facts report recorded 5,837 large trucks involved in fatal crashes, with 4,143 (71.0%) in the 26,001-pound-or-more category.24
Brake fade matters because those heavier vehicles must repeatedly convert mass and speed into heat. When heat exceeds the system’s capacity, stopping performance changes. That change can determine whether a truck stops short of traffic or reaches the hazard with too much speed remaining.
Sources
- [1] Heavy Road Vehicle Platoon Control Considering Brake Fade with Adaptive Mass and Road Gradient Estimation (2022).
- [2] Id.
- [3] Id.
- [4] Id.
- [5] Federal Motor Carrier Safety Administration, Brake Safety Systems Guidance (Publication FMCSA-ADO-14-004, February 2014).
- [6] Braking thermal behavior research, Energy (ScienceDirect, 2025).
- [7] Id.
- [8] Id.
- [9] University of Michigan Transportation Research Institute, Braking Strategy During Mountain Descents (UMTRI).
- [10] Id.
- [11] Id.
- [12] Federal Motor Carrier Safety Administration, Report to Congress on the Large Truck Crash Causation Study (March 2006).
- [13] Federal Motor Carrier Safety Administration, Using the LTCCS Data (Analysis Series).
- [14] Id. (Michigan FACT database, 1996–2001, used as example dataset).
- [15] Id.
- [16] Id.
- [17] Commercial Vehicle Safety Alliance, 2019 International Roadcheck Results.
- [18] Commercial Vehicle Safety Alliance, 2025 International Roadcheck Results.
- [19] Commercial Vehicle Safety Alliance, Operation Airbrake Brake Safety Campaign Results.
- [20] Commercial Vehicle Safety Alliance, 2025 Brake Safety Week Results.
- [21] National Transportation Safety Board, Highway Accident Report HAR-07/01, Motorcoach Fire on Interstate 45 During Hurricane Rita Evacuation (2005).
- [22] Id.
- [23] Federal Motor Carrier Safety Administration, Large Truck and Bus Crash Facts 2021.
- [24] Federal Motor Carrier Safety Administration, Large Truck and Bus Crash Facts 2022.